Everyone quotes the top 1%. It's the only figure anyone bothers modelling. Here's a reasoned attempt at the bands in between.
Search for India's top 1% wealth threshold and you'll find an answer within seconds: roughly ₹1.5 to ₹2 crore, cited everywhere. Search for the top 10%, or the top 20%, and the trail goes cold. Nobody publishes it. That gap is what this piece tries to close.
Published wealth research in India, chiefly the World Inequality Database, is built around a small number of headline reference points: the median, and the share of wealth held by the top 1% and top 10% as groups. Those are real, citable figures. What's missing is the individual entry threshold for anything in between, meaning the net worth that actually puts a single person at the 90th percentile, or the 80th. Nobody has published that table, so nobody quotes it, so the conversation defaults to the one number that does exist: the top 1%.
Everything below this point is FOLO's own interpolation, built by fitting a curve between the published reference points, not a citation from WID, AIDIS, or any other source. We're labelling it clearly because that distinction matters. See how we built the bands, below.
Three data points are solid, from the World Inequality Report 2026 and the World Inequality Database:
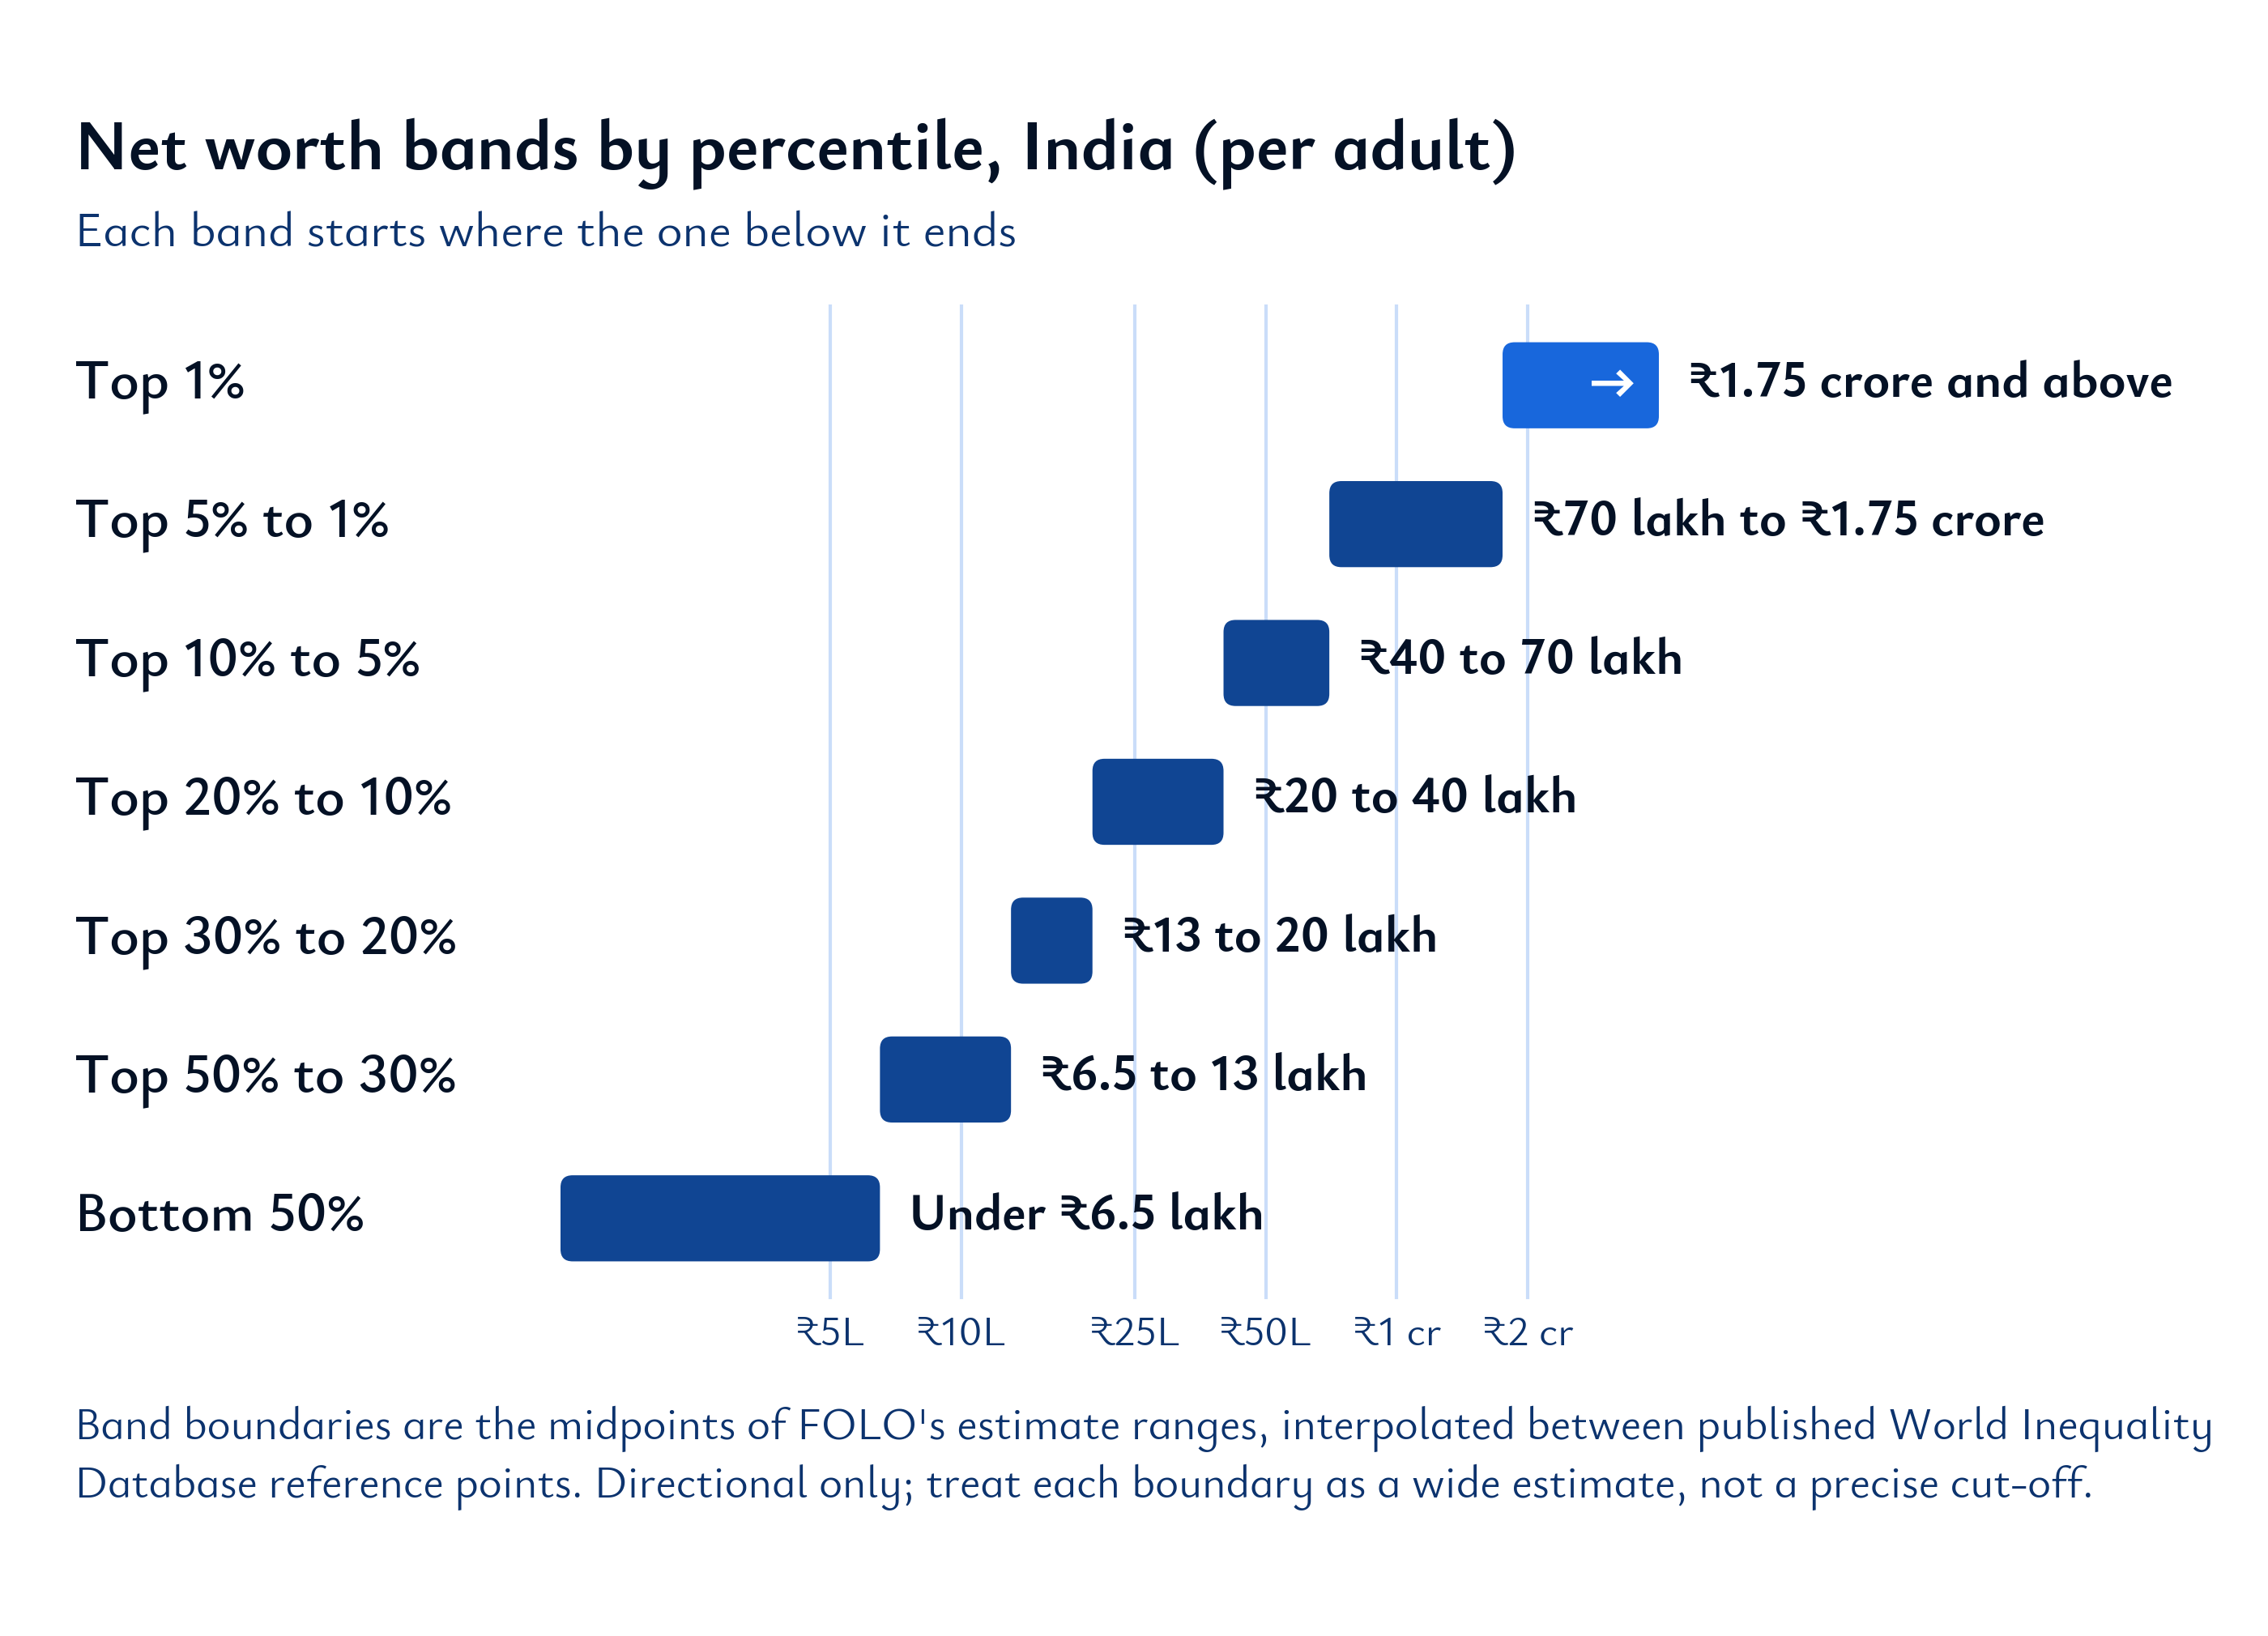
Wealth distributions this concentrated typically follow a curve that rises slowly through the middle and then steeply in the final few percentiles, a shape consistent with the log-normal body and Pareto tail that researchers use to model India's income and wealth data. Fitting a smooth curve of that shape between the three anchors above gives a directional bridge across the missing bands. Each entry point comes out as a range (top 10% at roughly ₹35 to 45 lakh, top 5% at ₹65 to 80 lakh, and so on), and the chart below uses the midpoint of each range as the boundary between bands, so every band starts where the one below it ends:
What typically got someone into each band:
Notice the top 1% number is quoted with more confidence than the bands just below it, even though it's arguably harder to estimate. That's a function of how research funding and attention work: the top 1% is the number people ask about, so it gets modelled more carefully. The bands in between are less certain, which is why we're presenting wider ranges and being explicit that this is FOLO's own bridge, not a republished statistic.
India's top 10% of earners capture about 58% of national income in a given year. The top 10% by wealth hold roughly 65% of total wealth, accumulated over decades. The two groups overlap substantially but aren't identical. Someone can earn their way into the income top 10% in a single strong year, while moving into the wealth top 10% almost always takes sustained saving and asset ownership over a much longer period.
Skip the estimate, see your real position
FOLO benchmarks your actual, connected net worth against India's wealth distribution and your peer group, so you're comparing yourself to a real number rather than an interpolated one.
Where Do I Stand Among All Indians? → | See My Peer Benchmark →
No official figure exists. Interpolating between published reference points puts it directionally around ₹35 to 45 lakh per adult. Treat this as a modelled estimate.
Directionally around ₹18 to 22 lakh per adult, based on interpolating published wealth-share data. Again, a reasoned estimate rather than a citation.
Published research anchors on a few headline figures, the median and the top 1% and top 10% wealth share, rather than a full percentile table, so the bands in between require modelling rather than citation.
Mostly overlapping but not identical. India's top 10% earners capture about 58% of national income in a given year, while the top 10% by wealth hold about 65% of wealth accumulated over decades.
Continue the series
FOLO is India's NetWorth app. Know your number, benchmark it, and watch it grow. Free, SEBI registered.
This article is for educational purposes and is not investment advice. Investment in securities market are subject to market risks. Percentile bands beyond the top 1% and top 10% are FOLO's own directional interpolation, not official or third-party published statistics.